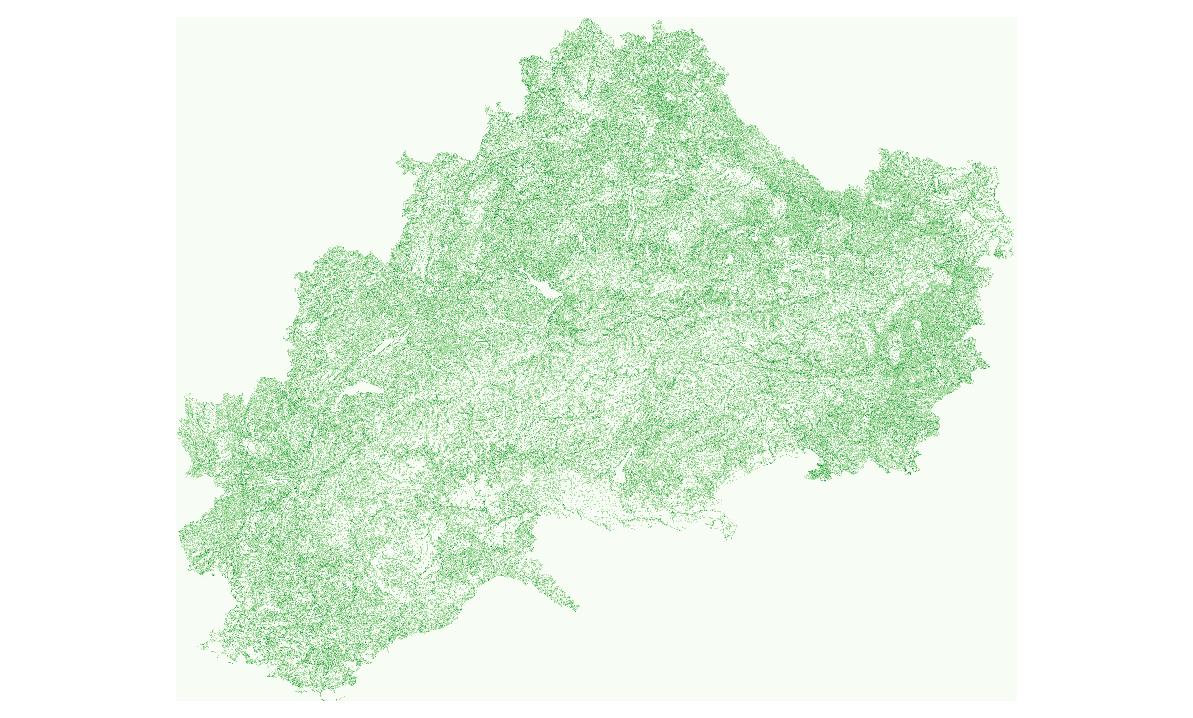
Maps
Europe,ADO,ADO_boundaries,ADO_region
Maps
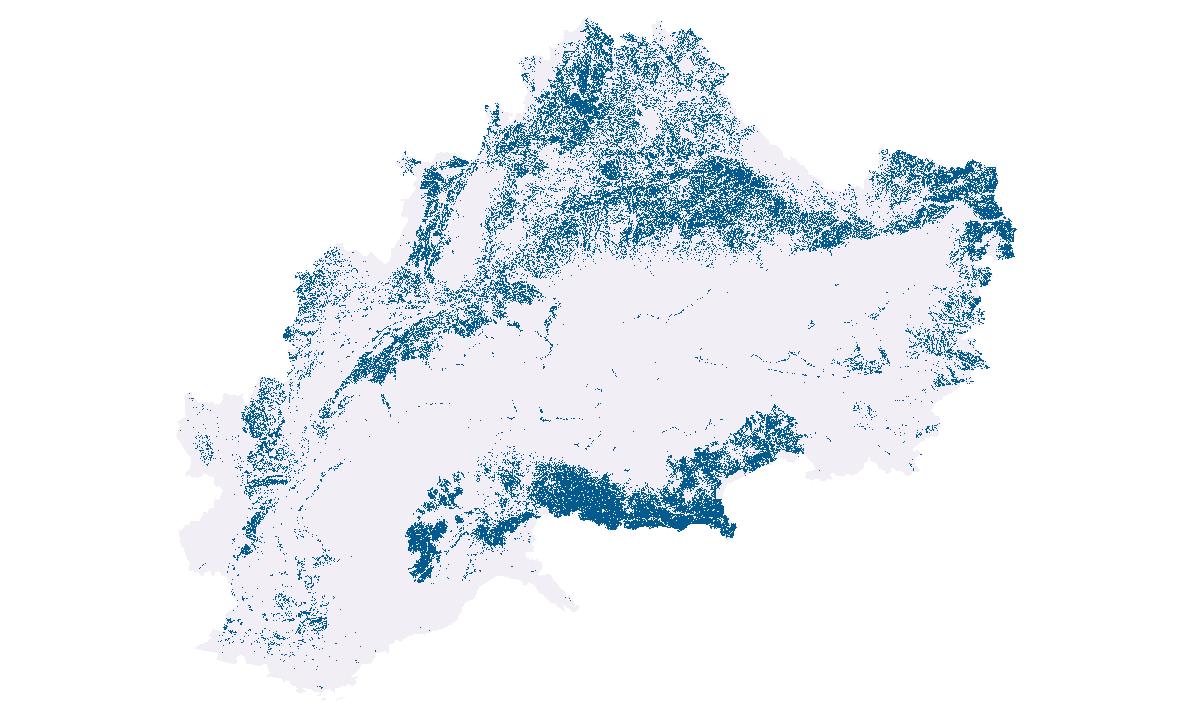
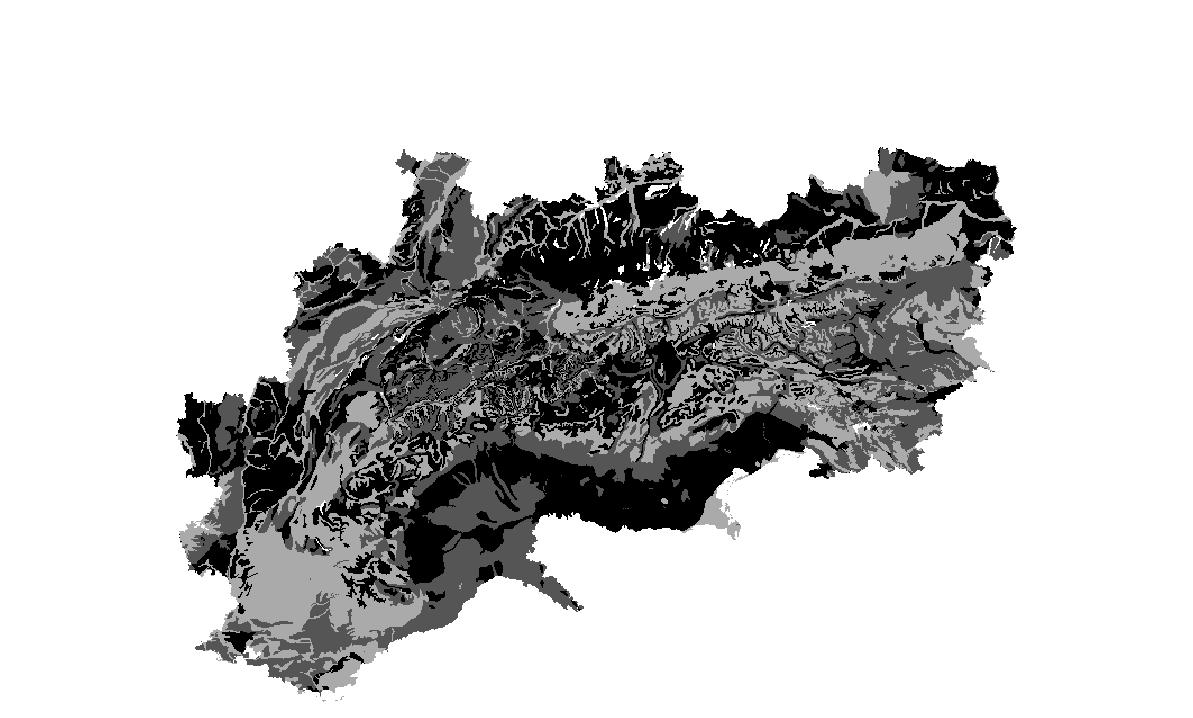
Europe,nuts2_alpinespaceEusalp_intersection
PostgreSQL
hydrology,water lever,discharge,database,ground station,cct,Environmental monitoring facilities,Hydrography
Jan. 1, 1869, 1 a.m.
![]() Dec. 31, 2021, 1 p.m.
Dec. 31, 2021, 1 p.m.
Other
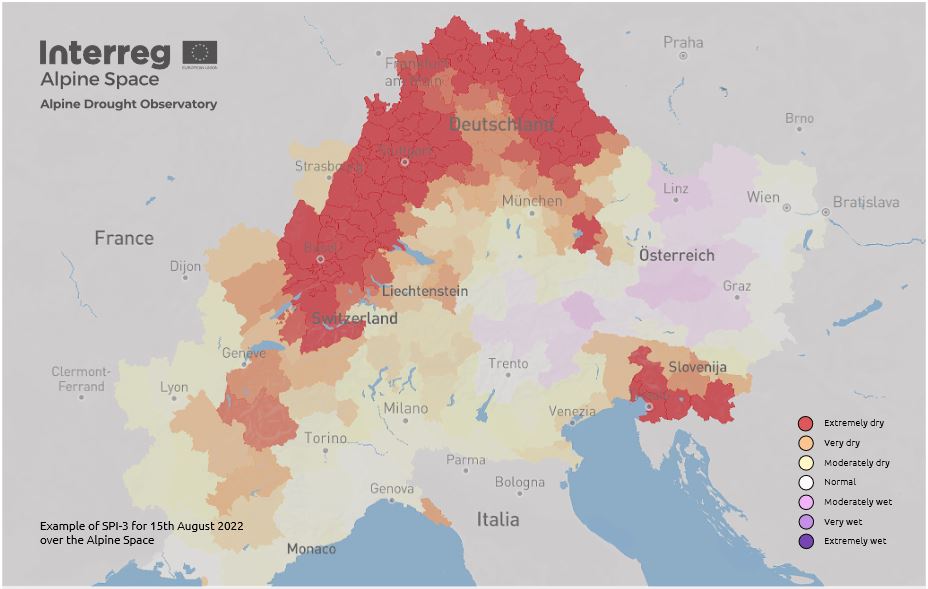
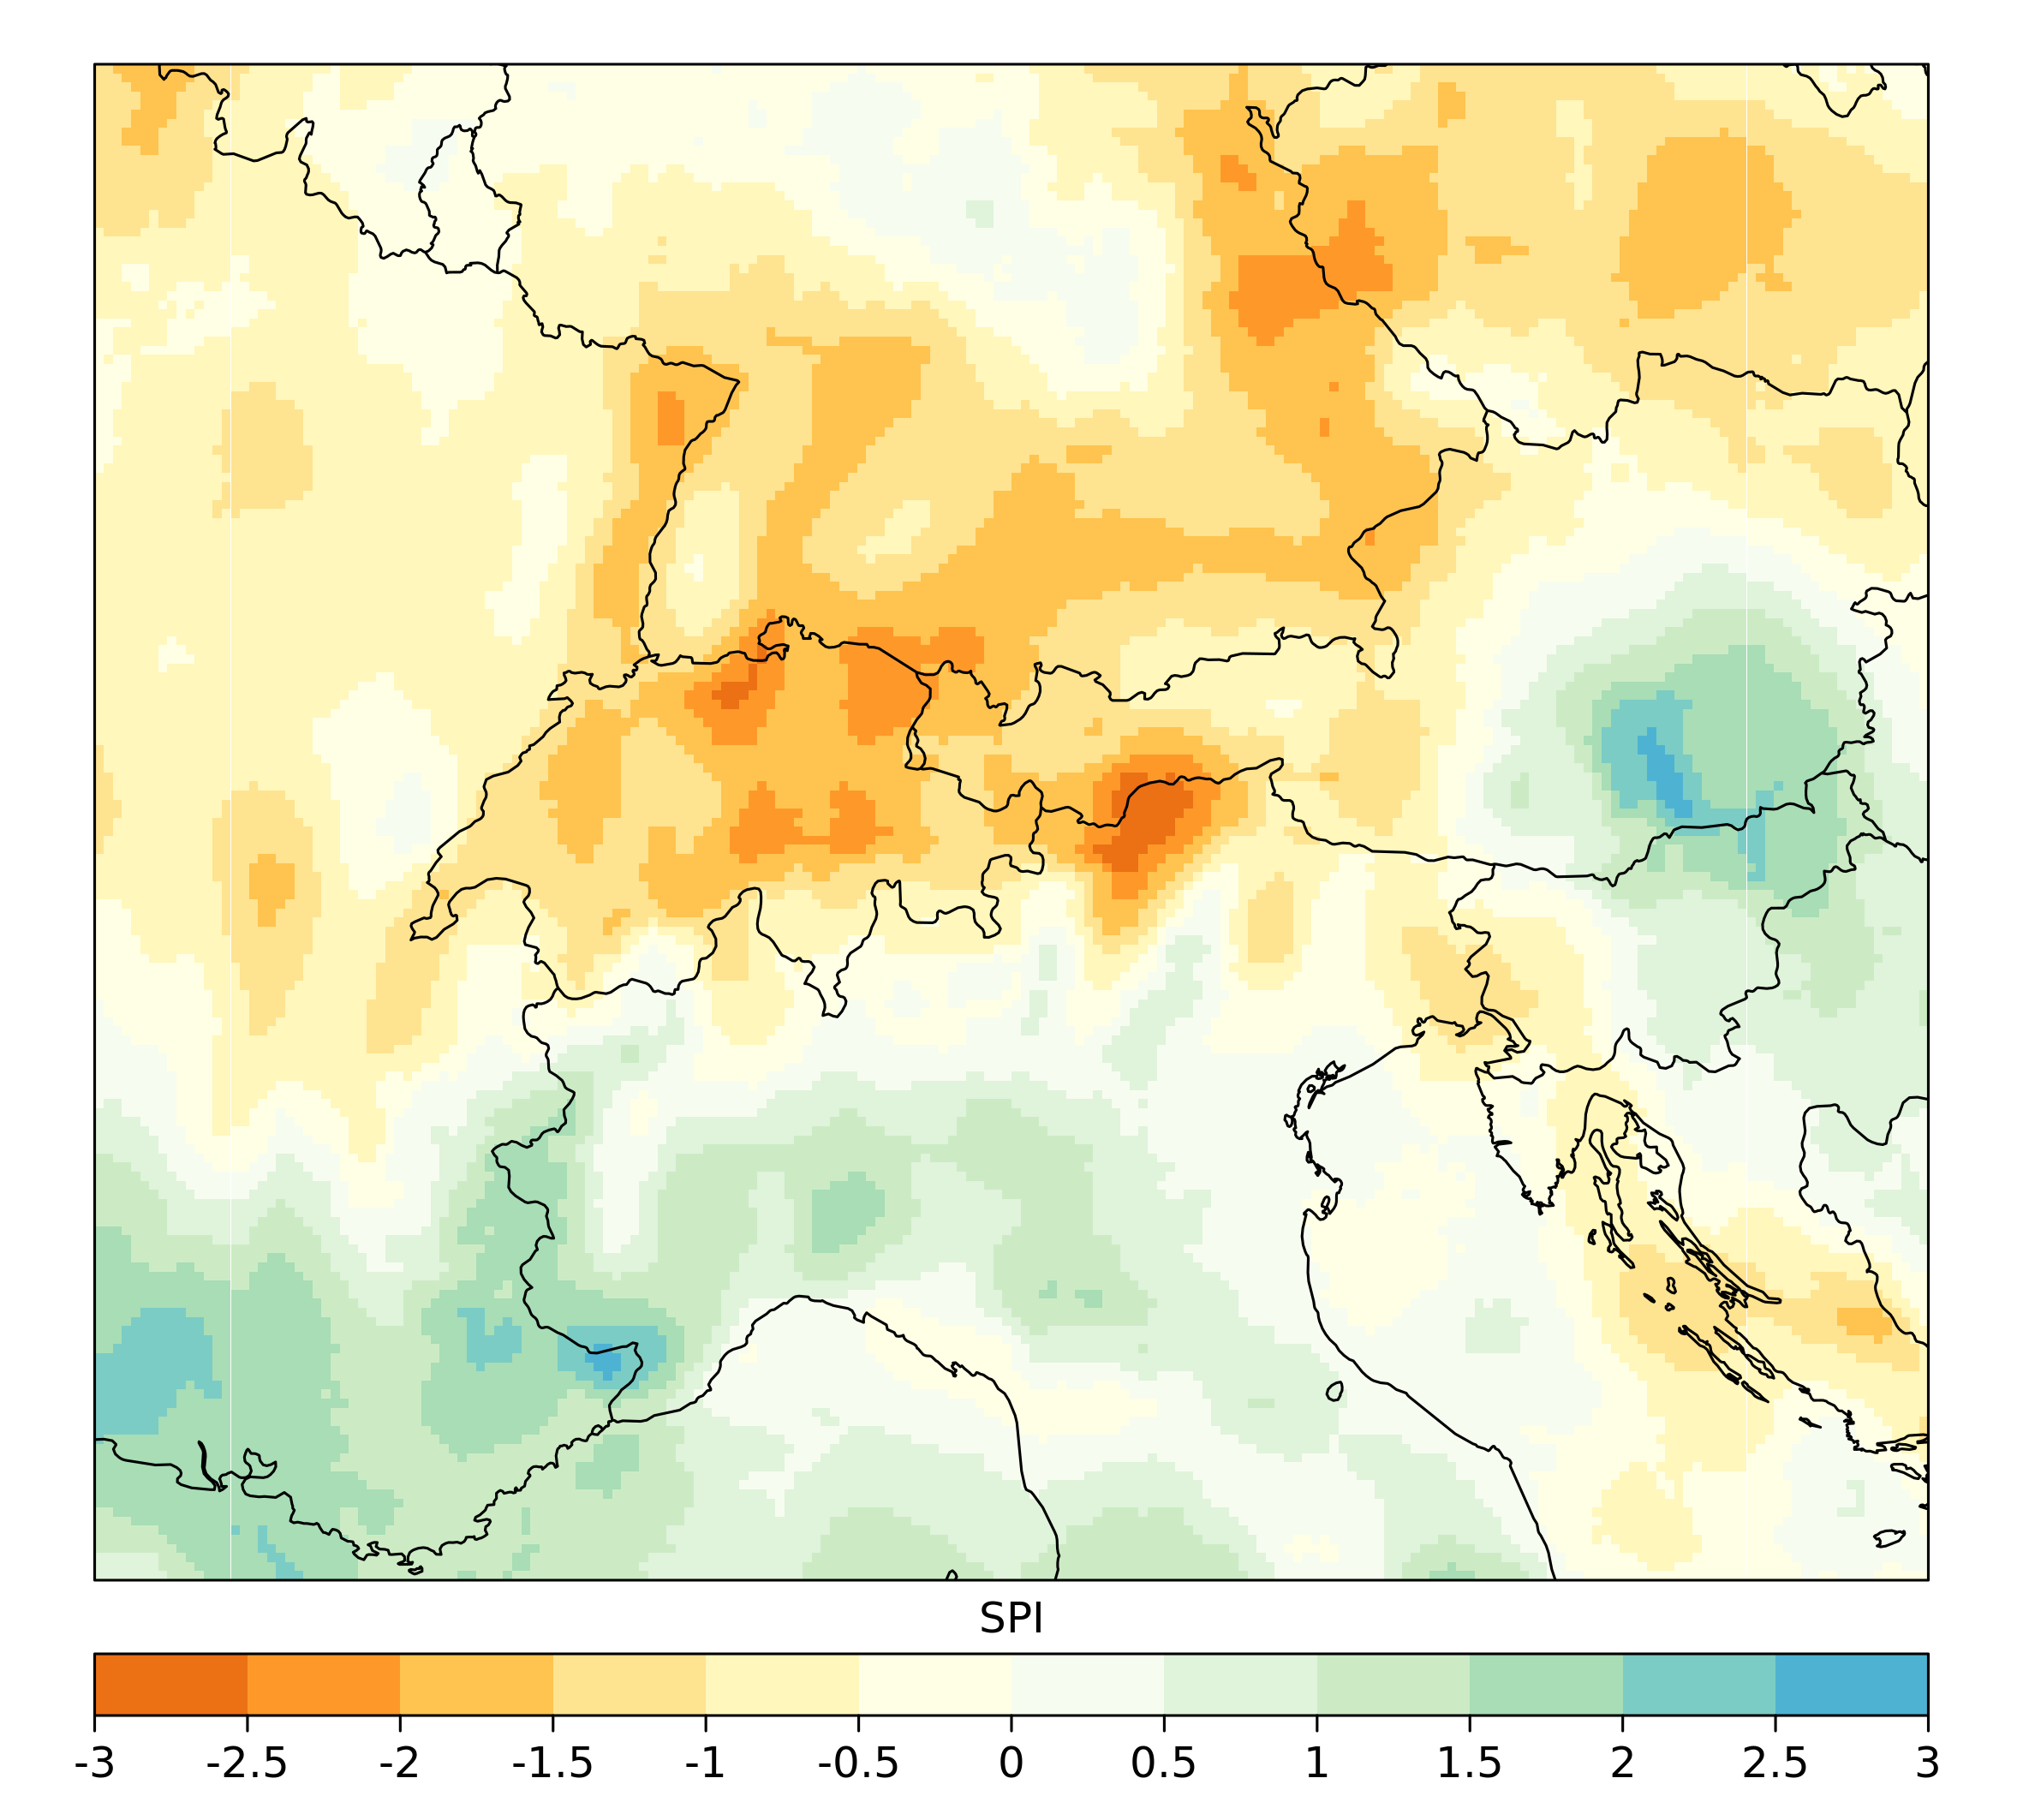
SPI,ADO,ADO project,Standardized Precipitation Index,ADO platform,cct,Slovenia,Italy,Europe,Austria,Hydrography,natural dynamics,natural areas, landscape, ecosystems,climate,disasters, accidents, risk,water
Jan. 1, 1979, 1 a.m.
![]() None
None
Other
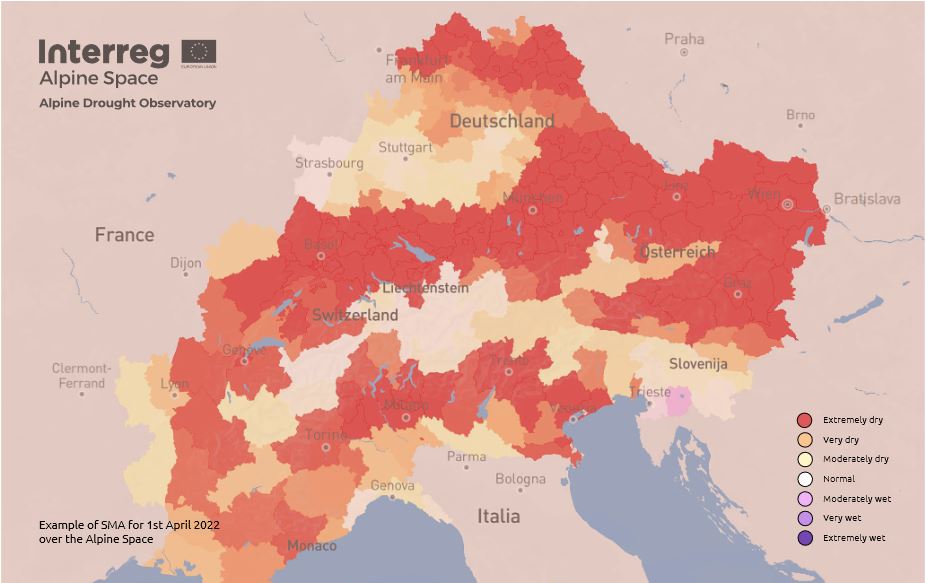
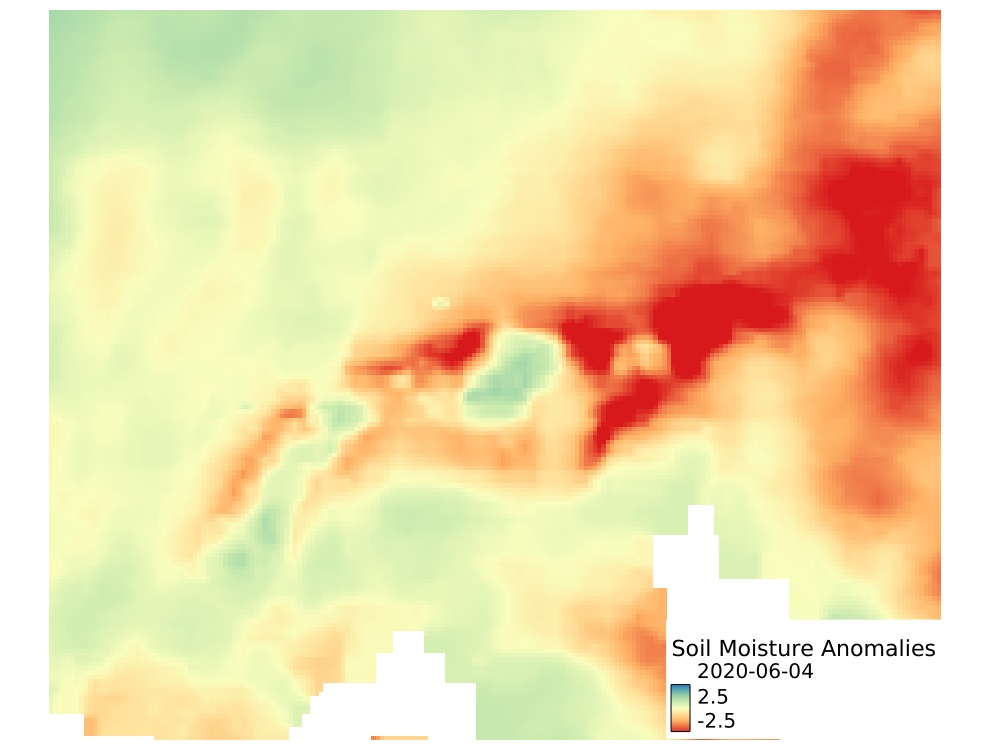
SMA,ADO,ADO project,Soil Moisture Anomalies,ADO platform,cct,Slovenia,Italy,Europe,Austria,Hydrography,natural dynamics,natural areas, landscape, ecosystems,climate,disasters, accidents, risk,water
Jan. 1, 1979, 1 a.m.
![]() None
None
Other
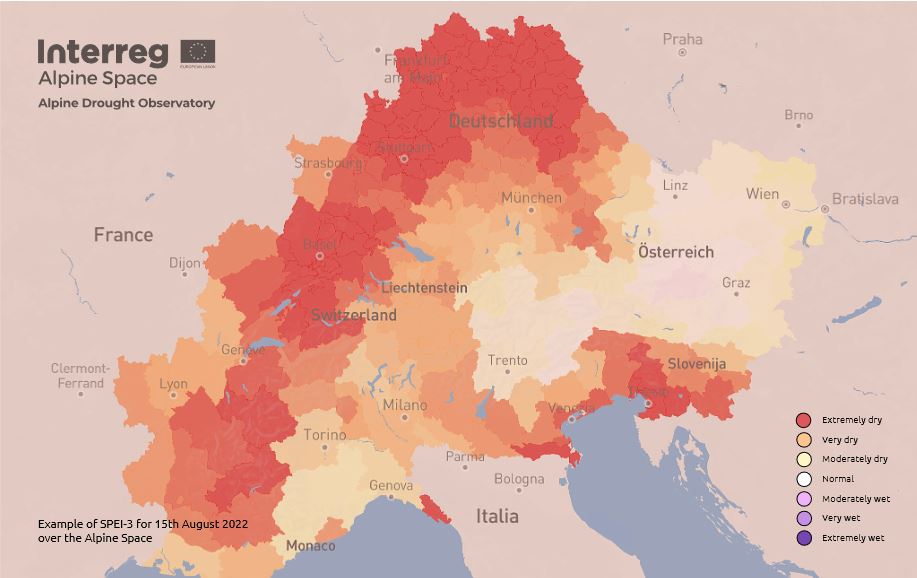
SPEI,ADO,ADO project,Standardized Precipitation-Evapotranspiration Index,ADO platform,cct,Europe,Slovenia,Austria,Italy,Hydrography,natural dynamics,natural areas, landscape, ecosystems,climate,disasters, accidents, risk,water
Jan. 1, 1979, 1 a.m.
![]() None
None
OpenEO
collection,Distance to large water bodies,ADO project,ADO,cct,N/A,Land use,Land cover
OpenEO
collection,permanent irrigated land,presence of irrigation infrastructure,ADO project,ADO,cct,N/A,Land use,Land cover
OpenEO
collection,SPEI,standardised precipitation-evapotranspiration index,surface water balance anomalies,ERA5,ADO project,ADO,cct,N/A,Land use,Land cover
Dec. 31, 1978, 1 p.m.
![]() Oct. 2, 2023, 2 p.m.
Oct. 2, 2023, 2 p.m.
OpenEO
collection,SPI,standardised precipitation index,precipitation anomalies,ADO project,ADO,cct,N/A,Land use,Land cover
Dec. 31, 1978, 1 p.m.
![]() Oct. 2, 2023, 2 p.m.
Oct. 2, 2023, 2 p.m.
OpenEO
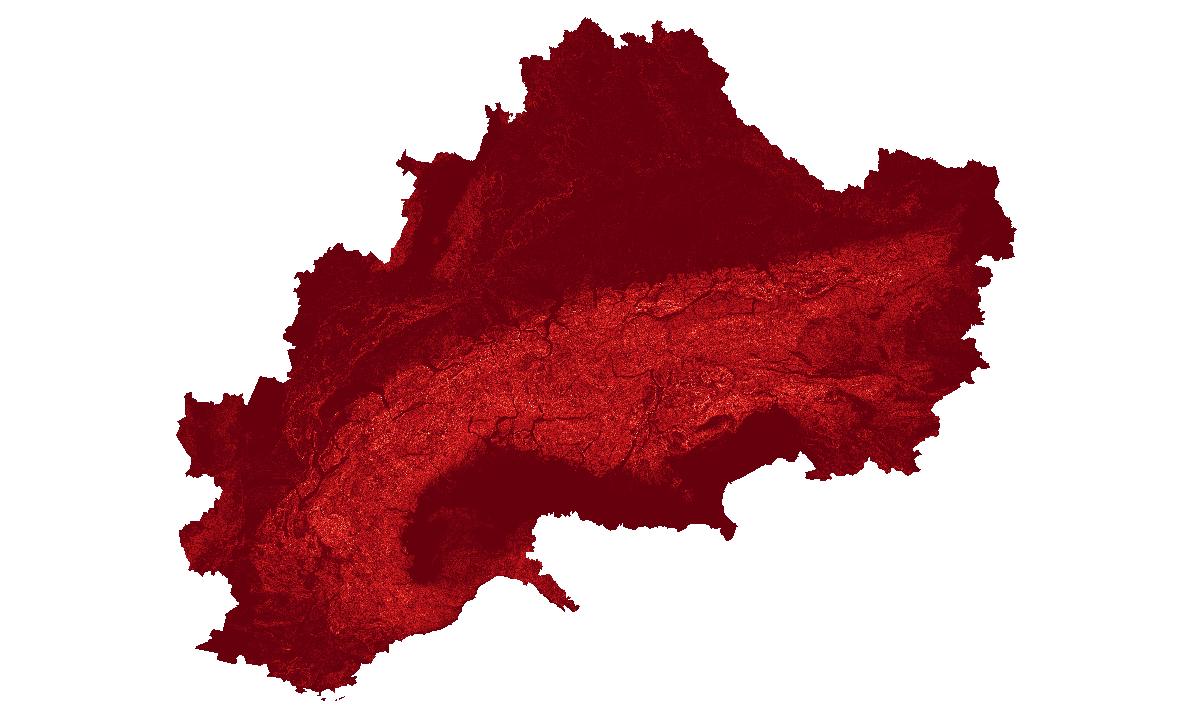
collection,Slope,Copernicus,Land,Elevation,Digital Elevation Model,Copernicus Land,Pan-European,ADO project,ADO,cct,N/A,Land use,Land cover
OpenEO
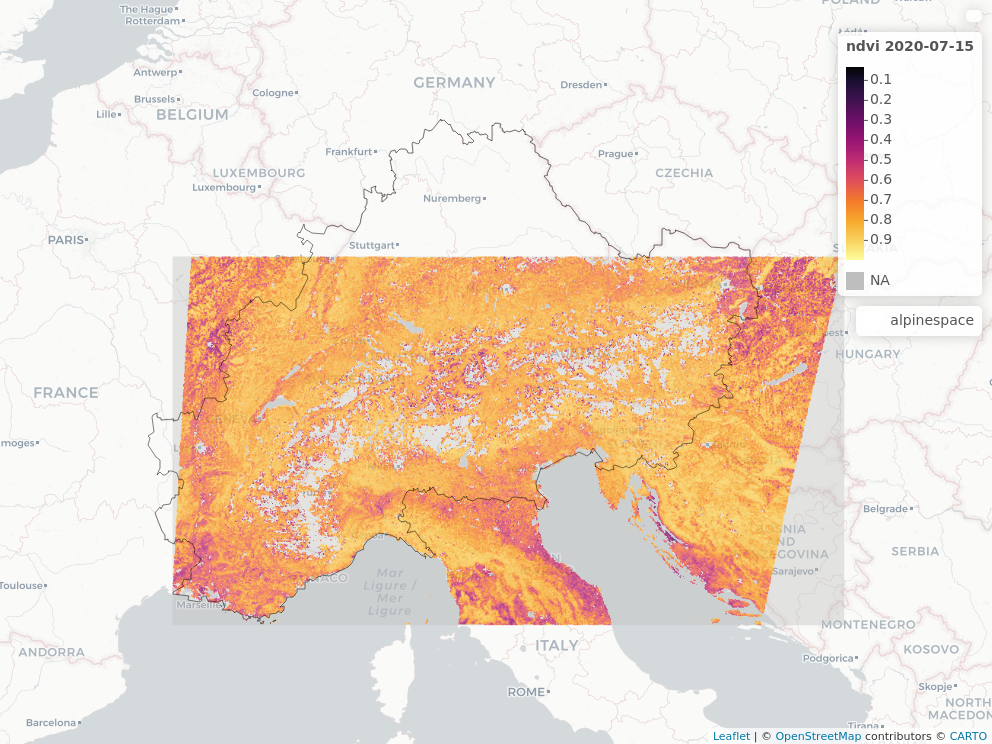
collection,normalized difference vegetation index,ndvi,modis,ADO project,ADO,Terra,Land use,Land cover
Jan. 1, 2001, 1 a.m.
![]() Jan. 3, 2021, 1 a.m.
Jan. 3, 2021, 1 a.m.
OpenEO
collection,soil Organic Carbon,Carbon content,ESDAC,topsoil,SOC,ADO project,ADO,cct,N/A,Land use,Land cover
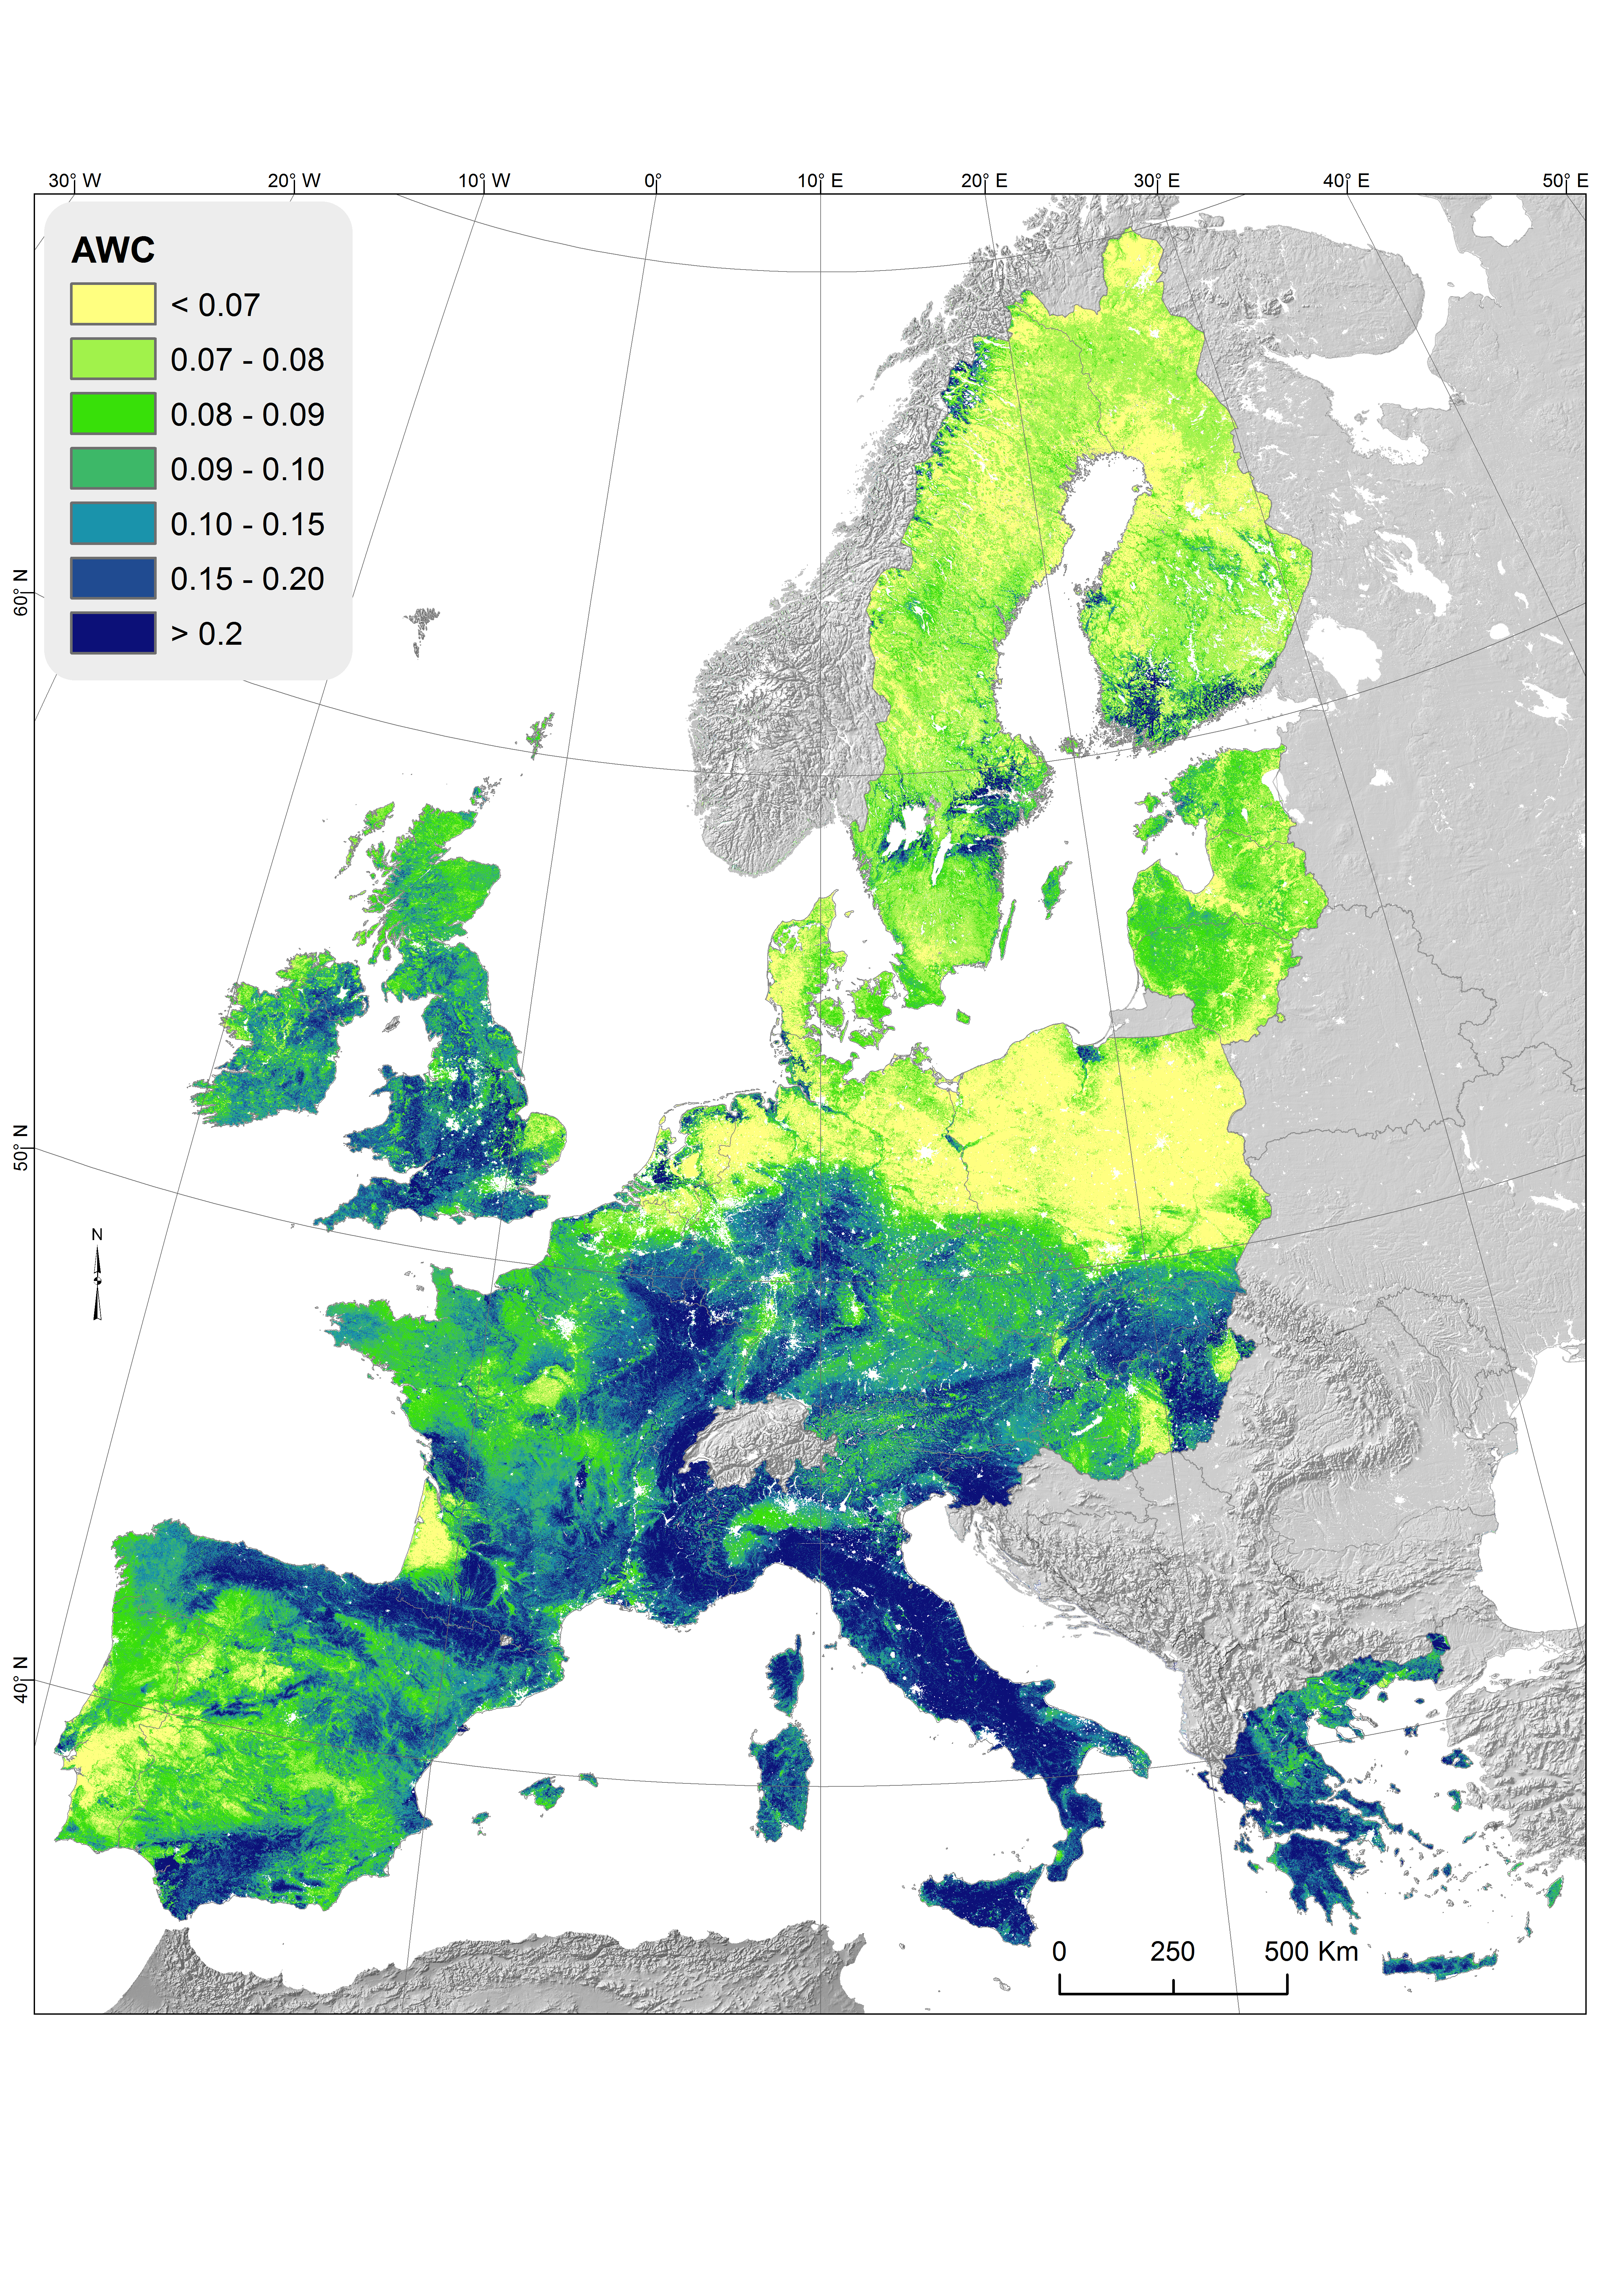
OpenEO
collection,soil map,available water capacity,ESDAC,LUCAS,topsoil,ADO project,ADO,cct,N/A,Land use,Land cover
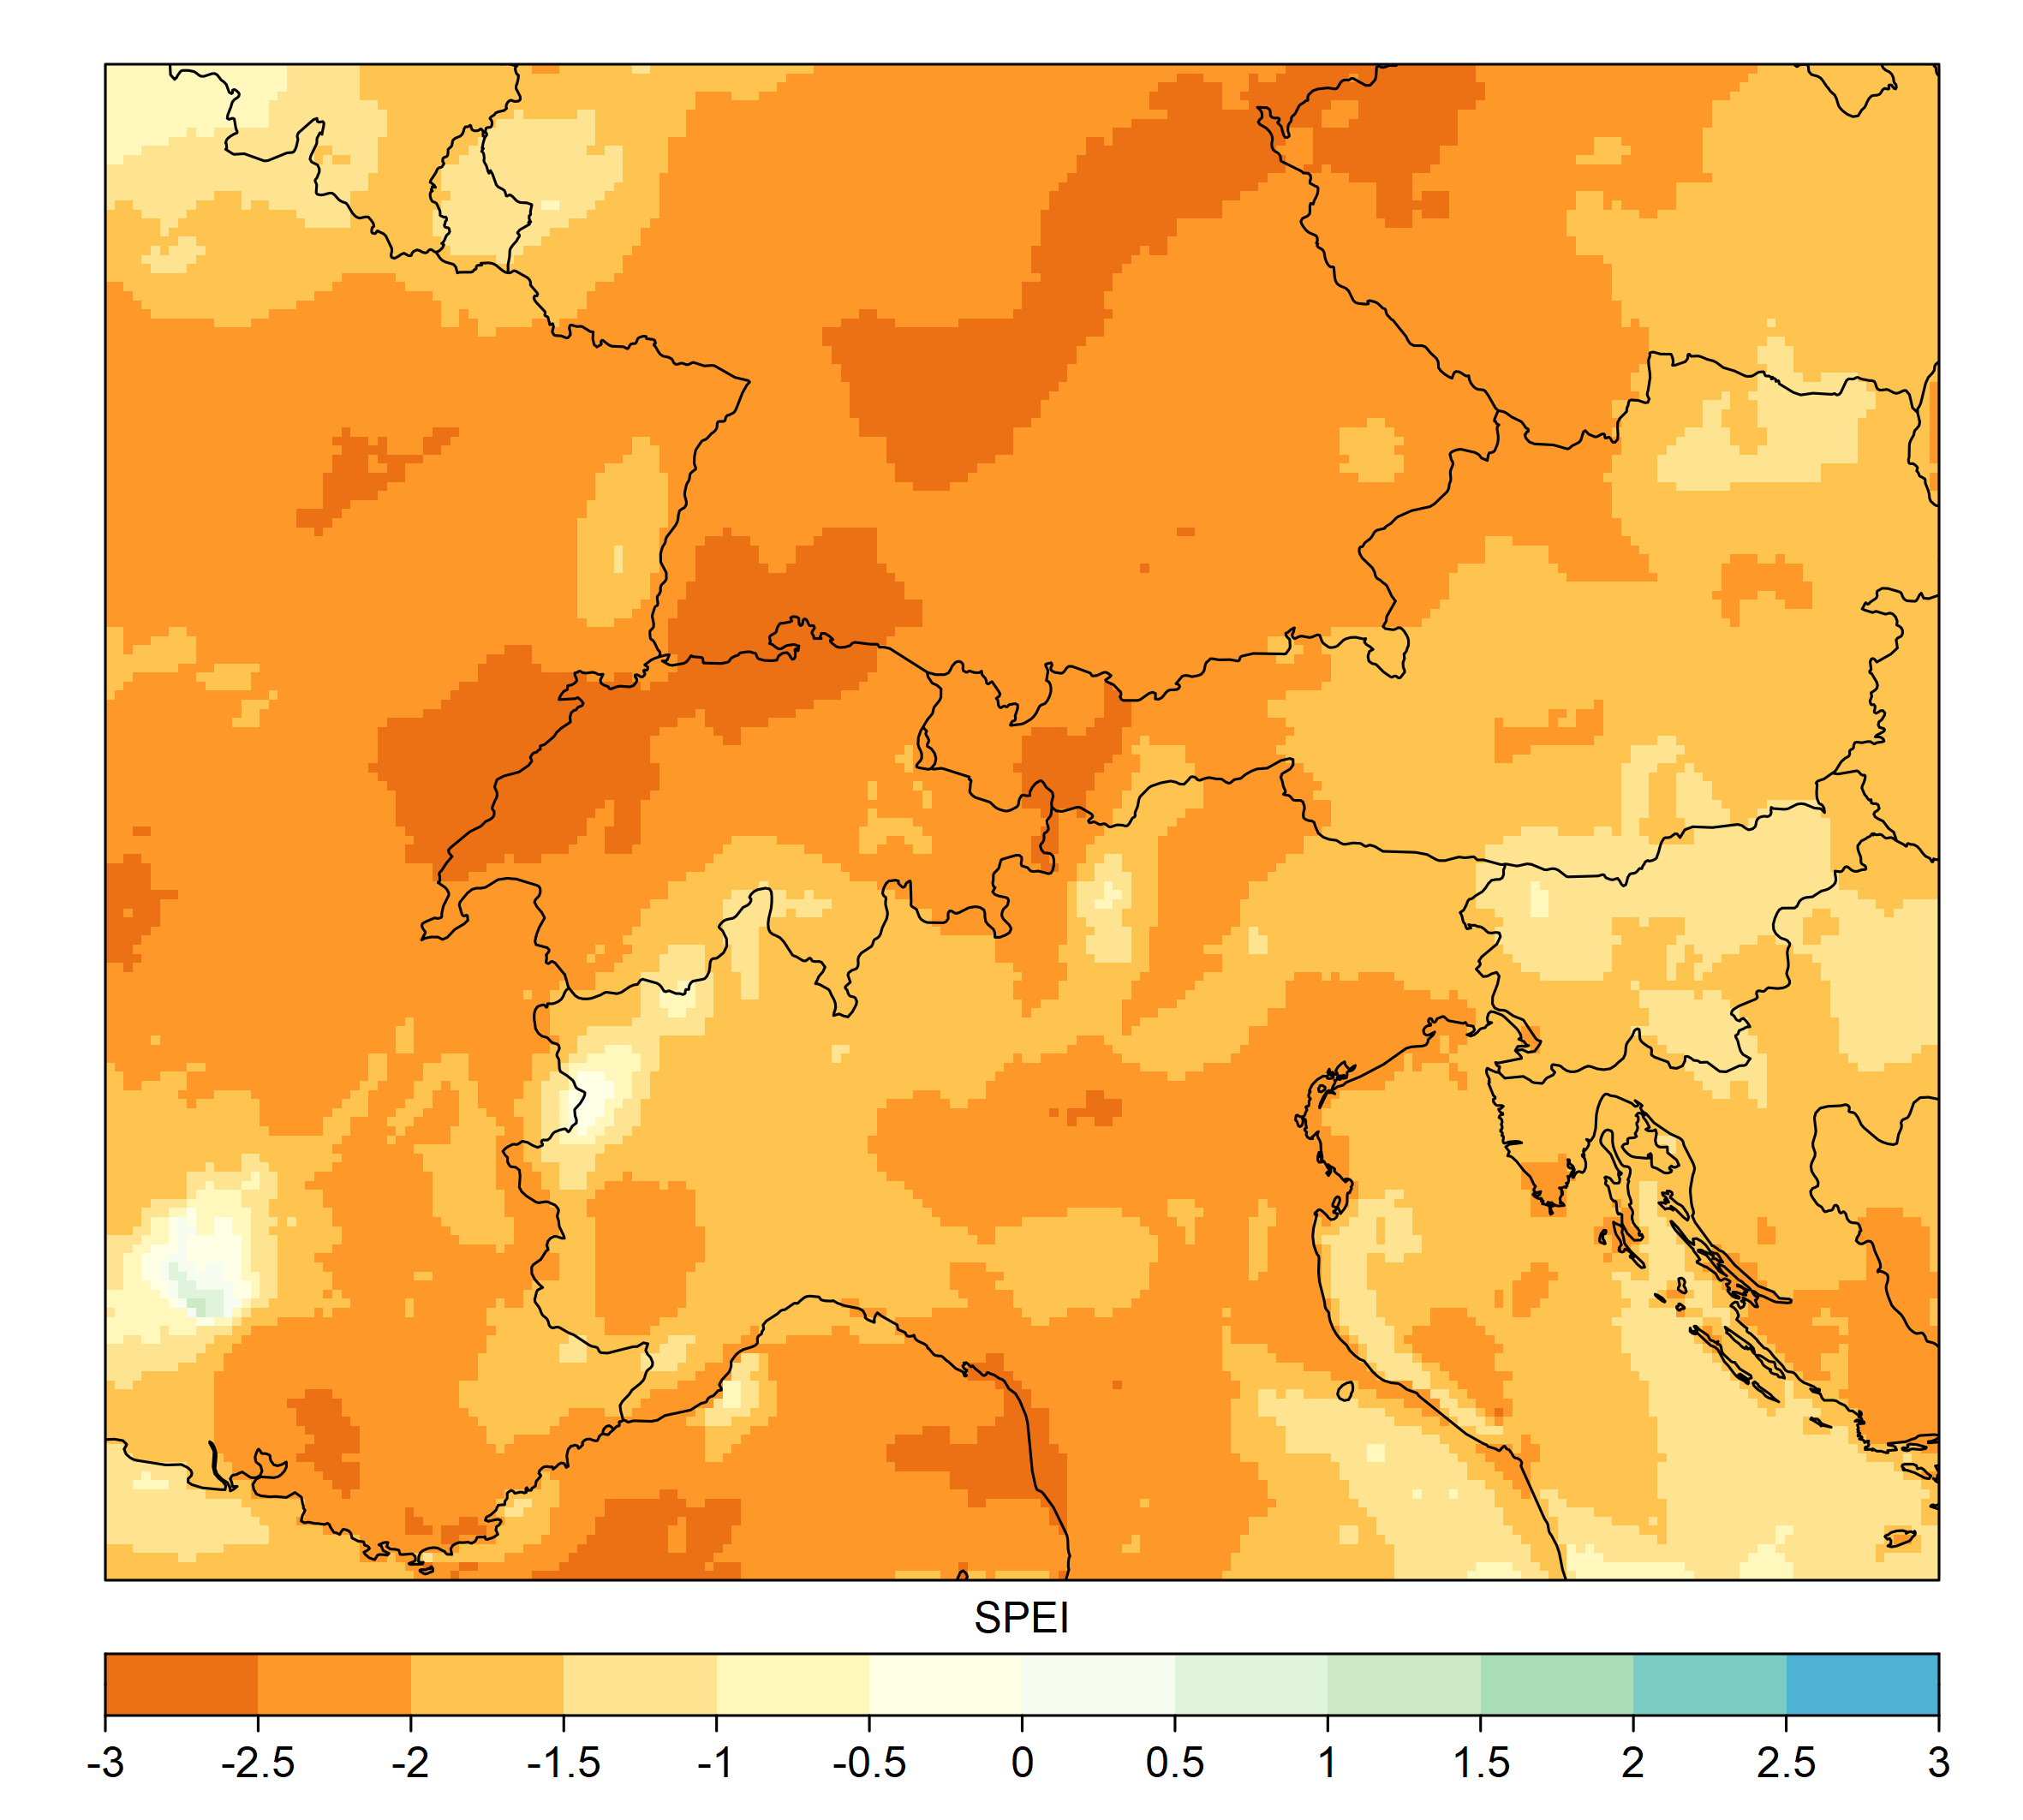
OpenEO
collection,SPEI,standardised precipitation-evapotranspiration index,surface water balance anomalies,ERA5,ADO project,ADO,cct,N/A,Land use,Land cover
Dec. 31, 1978, 1 p.m.
![]() Oct. 2, 2023, 2 p.m.
Oct. 2, 2023, 2 p.m.
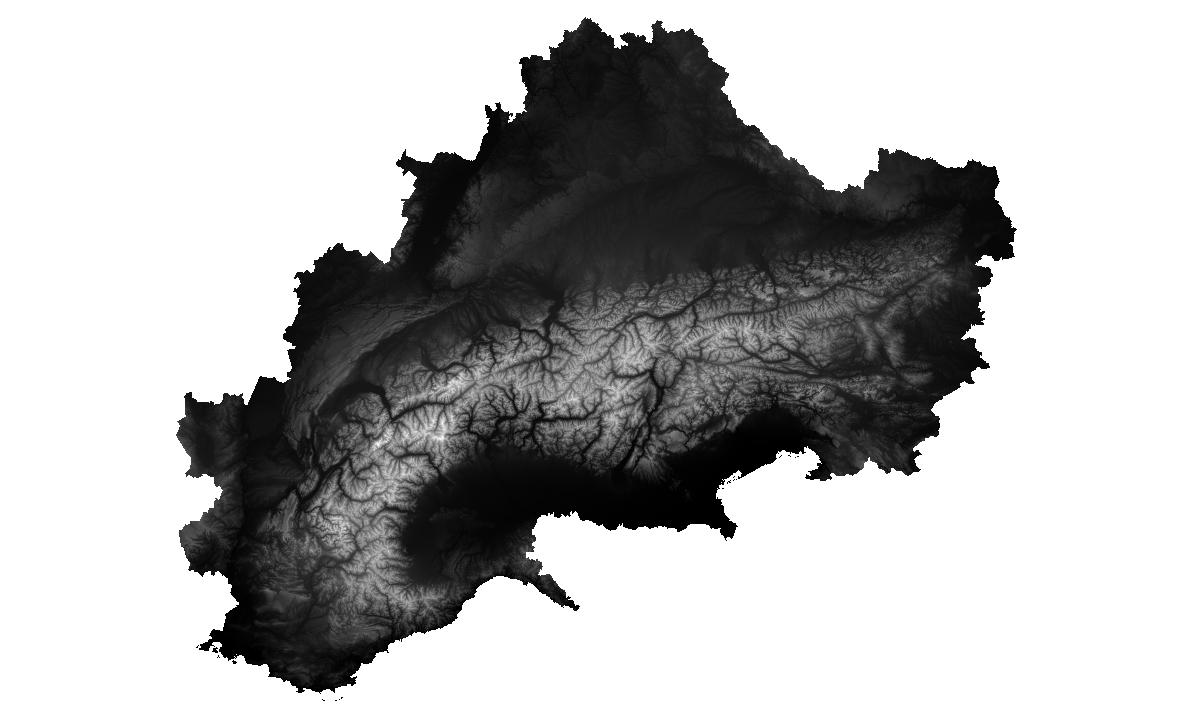
OpenEO
collection,Digital Elevation Model,Elevation,Copernicus Land,Copernicus,Alps,ADO project,ADO,cct,N/A,Land use,Land cover
OpenEO
collection,SPEI,standardised precipitation-evapotranspiration index,surface water balance anomalies,ERA5,ADO project,ADO,cct,N/A,Land use,Land cover
Dec. 31, 1978, 1 p.m.
![]() May 27, 2024, 2 p.m.
May 27, 2024, 2 p.m.
OpenEO
collection,SPI,standardised precipitation index,precipitation anomalies,ADO project,ADO,cct,N/A,Land use,Land cover
Dec. 31, 1978, 1 p.m.
![]() Oct. 2, 2023, 2 p.m.
Oct. 2, 2023, 2 p.m.
OpenEO
collection,SPEI,standardised precipitation-evapotranspiration index,surface water balance anomalies,ERA5,ADO project,ADO,cct,N/A,Land use,Land cover
Dec. 31, 1978, 1 p.m.
![]() Oct. 2, 2023, 2 p.m.
Oct. 2, 2023, 2 p.m.
OpenEO
collection,landscape diversity,Shannon eveness index,ADO project,ADO,cct,N/A,Land use,Land cover
OpenEO
collection,soil texture,soil textural classes,ESDAC,LUCAS,topsoil,ADO project,ADO,N/A,Land use,Land cover
OpenEO
collection,SPEI,standardised precipitation-evapotranspiration index,surface water balance anomalies,ERA5,ADO project,ADO,cct,N/A,Land use,Land cover
Dec. 31, 1978, 1 p.m.
![]() Oct. 2, 2023, 2 p.m.
Oct. 2, 2023, 2 p.m.
OpenEO
collection,SPI,standardised precipitation index,precipitation anomalies,ADO project,ADO,cct,N/A,Land use,Land cover
Dec. 31, 1978, 1 p.m.
![]() Oct. 2, 2023, 2 p.m.
Oct. 2, 2023, 2 p.m.
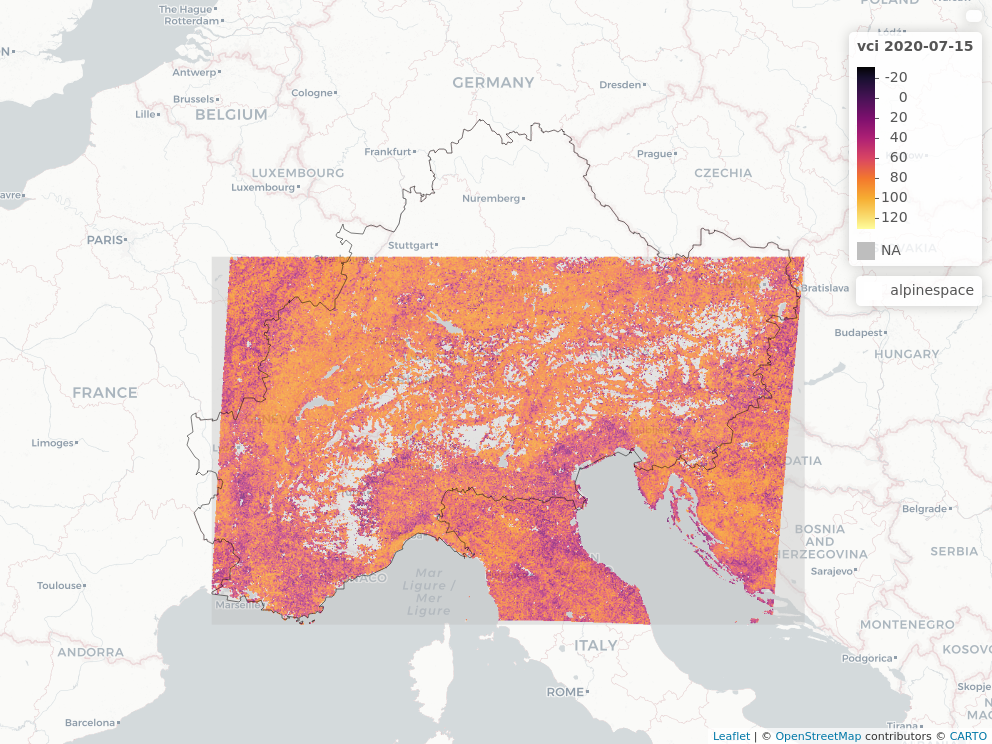
OpenEO
collection,vegetation condition index,vci,modis,ADO project,ADO,Terra,Land use,Land cover
Jan. 1, 2001, 1 a.m.
![]() Aug. 29, 2022, 2 a.m.
Aug. 29, 2022, 2 a.m.
OpenEO
collection,SPI,standardised precipitation index,precipitation anomalies,ADO project,ADO,cct,N/A,Land use,Land cover
Dec. 31, 1978, 1 p.m.
![]() April 24, 2019, 2 p.m.
April 24, 2019, 2 p.m.
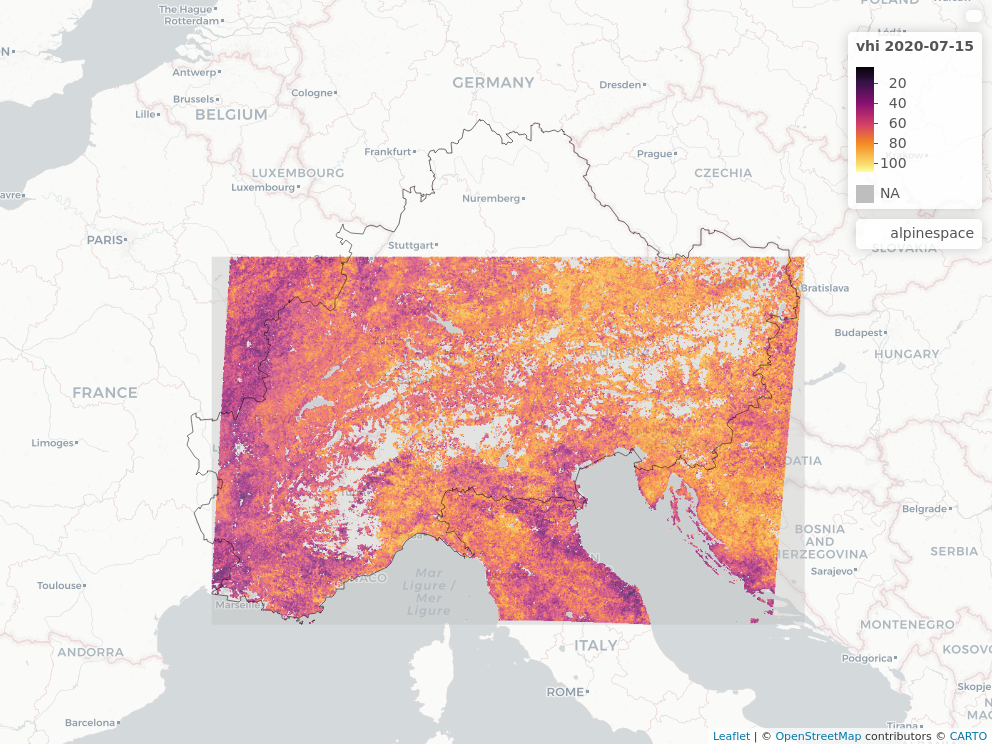
OpenEO
collection,vegetation health index,vhi,modisi,ADO project,ADO,Terra,Land use,Land cover
Jan. 1, 2001, 1 a.m.
![]() Aug. 29, 2022, 2 a.m.
Aug. 29, 2022, 2 a.m.
OpenEO
collection,SPI,standardised precipitation index,precipitation anomalies,ADO project,ADO,cct,N/A,Land use,Land cover
Dec. 31, 1978, 1 p.m.
![]() Oct. 2, 2023, 2 p.m.
Oct. 2, 2023, 2 p.m.
OpenEO
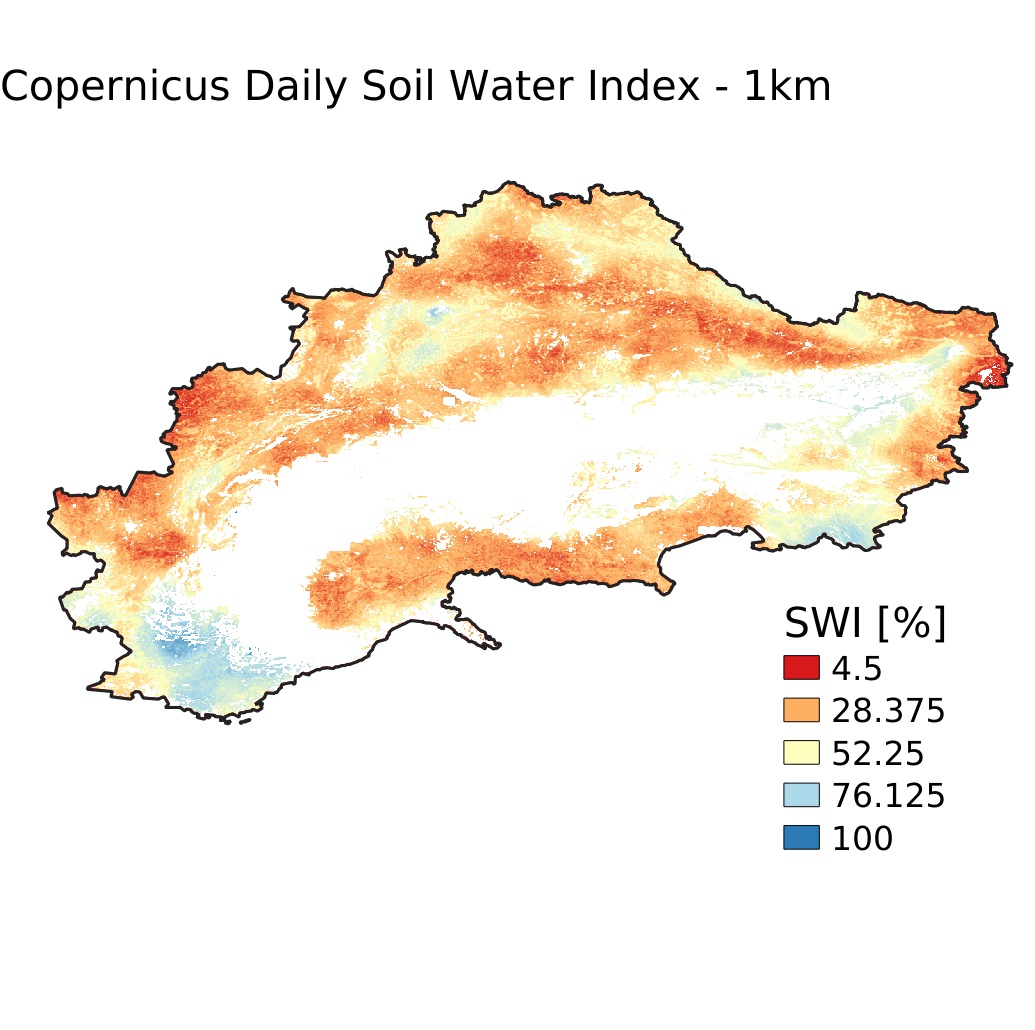
collection,Soil Moisture,Alpine Drought Observatory,Soil Moisture Anomalies,ERA5,Collection,ADO project,ADO,cct,N/A,Land use,Land cover
Dec. 31, 1979, 1 p.m.
![]() May 27, 2024, 2 p.m.
May 27, 2024, 2 p.m.
Maps
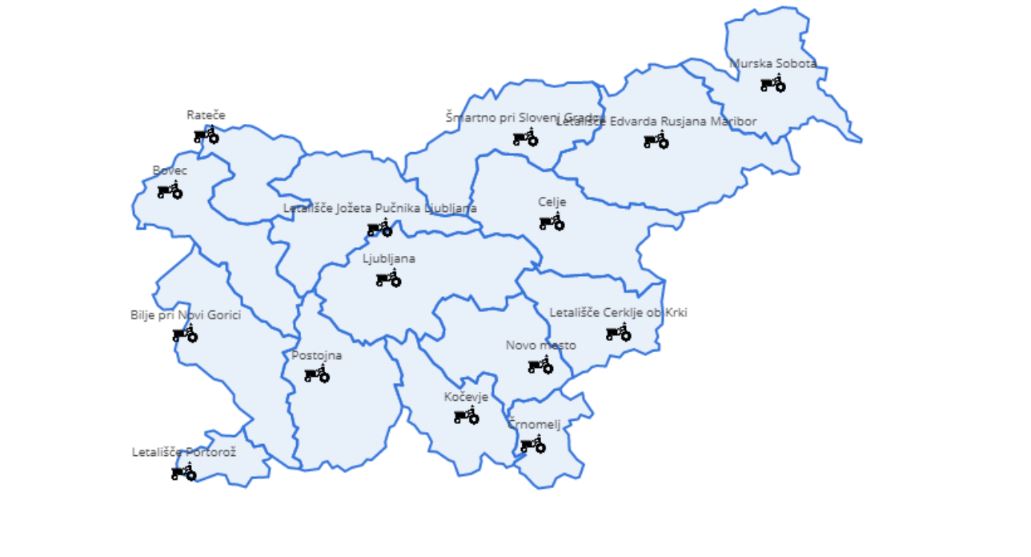
Europe,ADO,cct,features,hydro_station_wtl_ado_32632,level,water
Other
SPEI,SPI,Slovenia,ADO,ADO project,ADO platform,cct,Slovenia,Europe,Hydrography,natural areas, landscape, ecosystems,natural dynamics,climate,disasters, accidents, risk,water
Jan. 1, 1979, 1 a.m.
![]() None
None
Other
SPEI,ADO,ADO project,Snowgrid,ADO platform,cct,Italy,Europe,Austria,Slovenia,Hydrography,natural dynamics,natural areas, landscape, ecosystems,climate,disasters, accidents, risk,water
Jan. 1, 1979, 1 a.m.
![]() None
None
Other
SMA,ADO,ADO project,Soil Moisture Anomalies,ADO platform,cct,Slovenia,Europe,Italy,Austria,Hydrography,natural dynamics,water,natural areas, landscape, ecosystems,climate,disasters, accidents, risk
Jan. 1, 1979, 1 a.m.
![]() None
None
Other
SPEI,SPI,Slovenia,ADO,ADO project,ADO platform,cct,Slovenia,Europe,Hydrography,natural dynamics,natural areas, landscape, ecosystems,climate,disasters, accidents, risk,water
Jan. 1, 1979, 1 a.m.
![]() None
None
Other
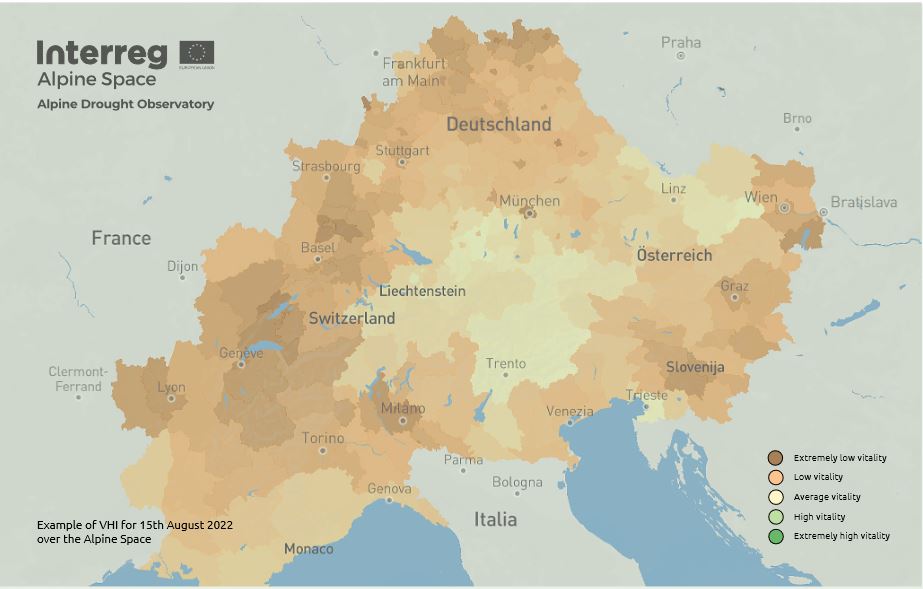
VHI,VCI,Vegetation Health Index,Vegetation Condition Index,ADO platform,ADO,ADO project,cct,Slovenia,Italy,Europe,Austria,Hydrography,natural dynamics,natural areas, landscape, ecosystems,climate,disasters, accidents, risk,water
Jan. 1, 1979, 1 a.m.
![]() None
None
Other
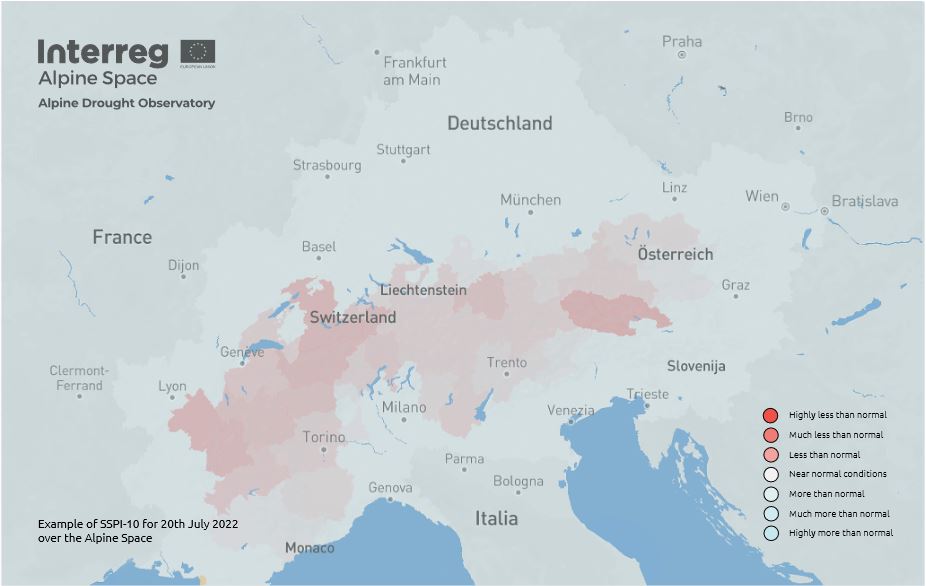
SSPI,ADO,ADO project,Standardized Snowpack Index,ADO platform,cct,Slovenia,Italy,Europe,Austria,Hydrography,natural dynamics,natural areas, landscape, ecosystems,climate,disasters, accidents, risk,water
Jan. 1, 1979, 1 a.m.
![]() None
None
Maps
Europe,cct,discharge,features,hydro_station_ado_32632,river,water
OpenEO
collection,surface soil moisture,ASCAT,Sentinel-1,ADO project,ADO,Sentinel-1 A/B; MetOp A/B,Land use,Land cover
Jan. 1, 2015, 1 a.m.
![]() April 19, 2020, 2 a.m.
April 19, 2020, 2 a.m.
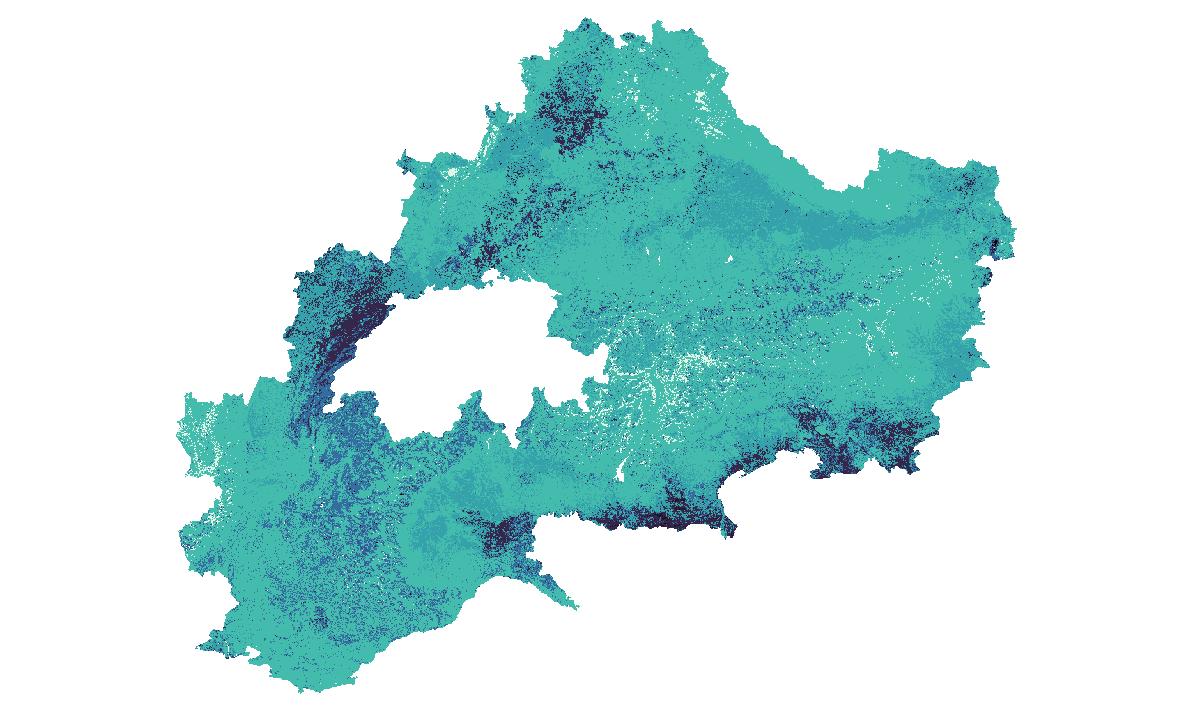
Maps
Global,cct,climate,GeoTIFF,KG_climate_class_clip,WCS
Maps
Europe,ADO,alp,eusalp